
Do You Know Your Helpdesk Numbers?
Six metrics that separate a profitable Helpdesk from a leaking one. Check your score today.
Most MSPs think their Helpdesk is running fine. The numbers usually tell a different story.
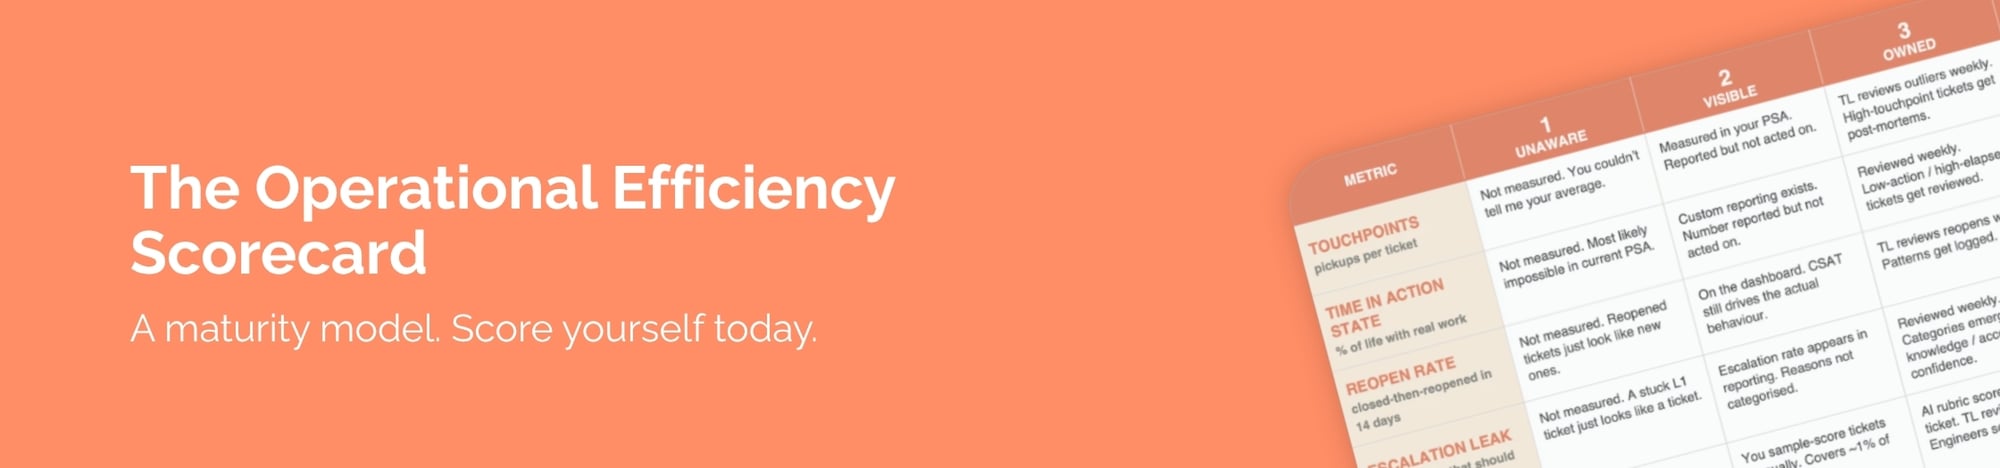
The Helpdesk Scorecard breaks down six metrics that quietly decide whether your Helpdesk is protecting your margins or eating them. Each one is simple to measure, easy to misunderstand, and expensive to ignore.
What's inside:
-
Touchpoints. How many times a ticket gets handled before it's resolved, and why every extra hand costs you money.
-
Time in Action State. What percentage of a ticket's life is actually spent working it, versus sitting waiting.
-
Reopen Rate. How many of your closed tickets come back within 14 days, and what that really means.
-
Escalation Leak. How many L2 and L3 tickets land on your desk that should have been solved at L1.
-
Time to Quality Response. Why first response time is a vanity metric, and what to measure instead.
-
The Three Moves. Diagnose, Equip, Manage. A practical framework to fix what the scorecard finds.
Why it matters: These are the same metrics we use at Uptime to help 300+ MSPs worldwide run Helpdesks that hold their SLAs, keep clients happy, and protect margins. Now you can score yourself.
Download to Unlock Full Details